What it shows
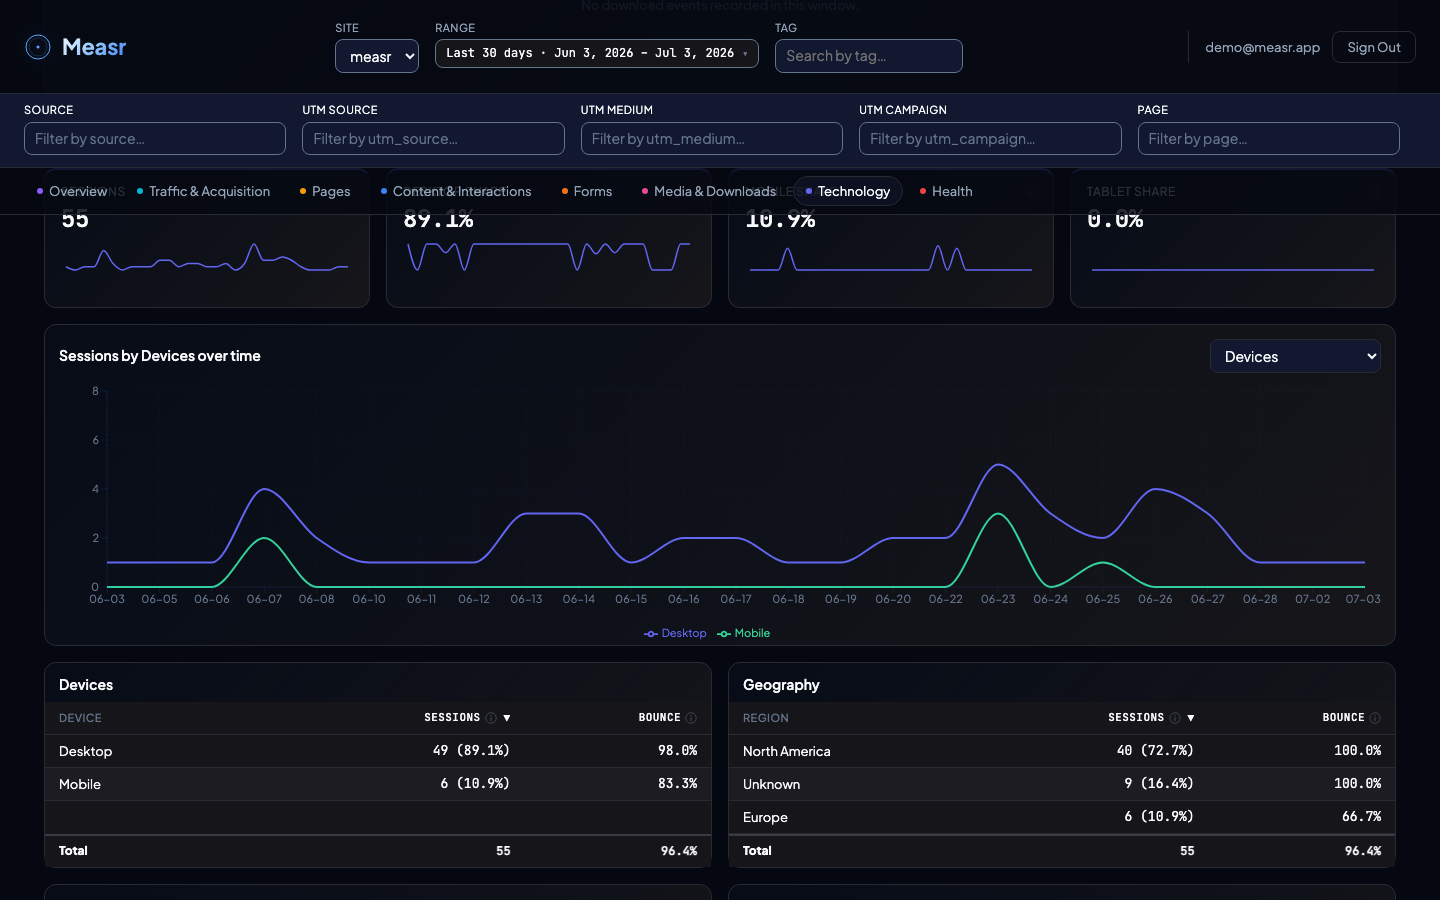
Four KPIs (Sessions, Desktop Share, Mobile Share, Tablet Share), a Sessions trend chart switchable between Devices, Browsers, Operating Systems, and Geography, and four tables: Devices, Geography, Browsers, and Operating Systems.
What the numbers mean
- Desktop / Mobile / Tablet Share: % of sessions on that device category.
- Bounce (Devices and Geography tables): % of that row's sessions with a single page view and no engagement event. A mobile bounce far above desktop usually means a layout problem, not an audience problem.
- Geography: a coarse region grouping derived from the browser timezone. There is no IP geolocation, in keeping with the no-PII design, so expect regions, not cities.
How the filters apply
The section respects the global filters, and every table is clickable: select a device, region, browser, or OS to narrow the section to that segment; click again to clear.
How to implement it
Nothing to configure: device category, browser, OS, and timezone-derived region are captured automatically with each session by the SDK. See tracking modules for what else fires on its own.