Signing in
The dashboard is auth-gated: only users you created in Supabase can read data. On the public demo the credentials are pre-filled, so a single click on Sign In takes you in. On your own install, Forgot password? on the sign-in screen emails a recovery link that brings you back to the dashboard you requested it from (v1.6.1); the Supabase side of that is covered in manual setup.
The header controls
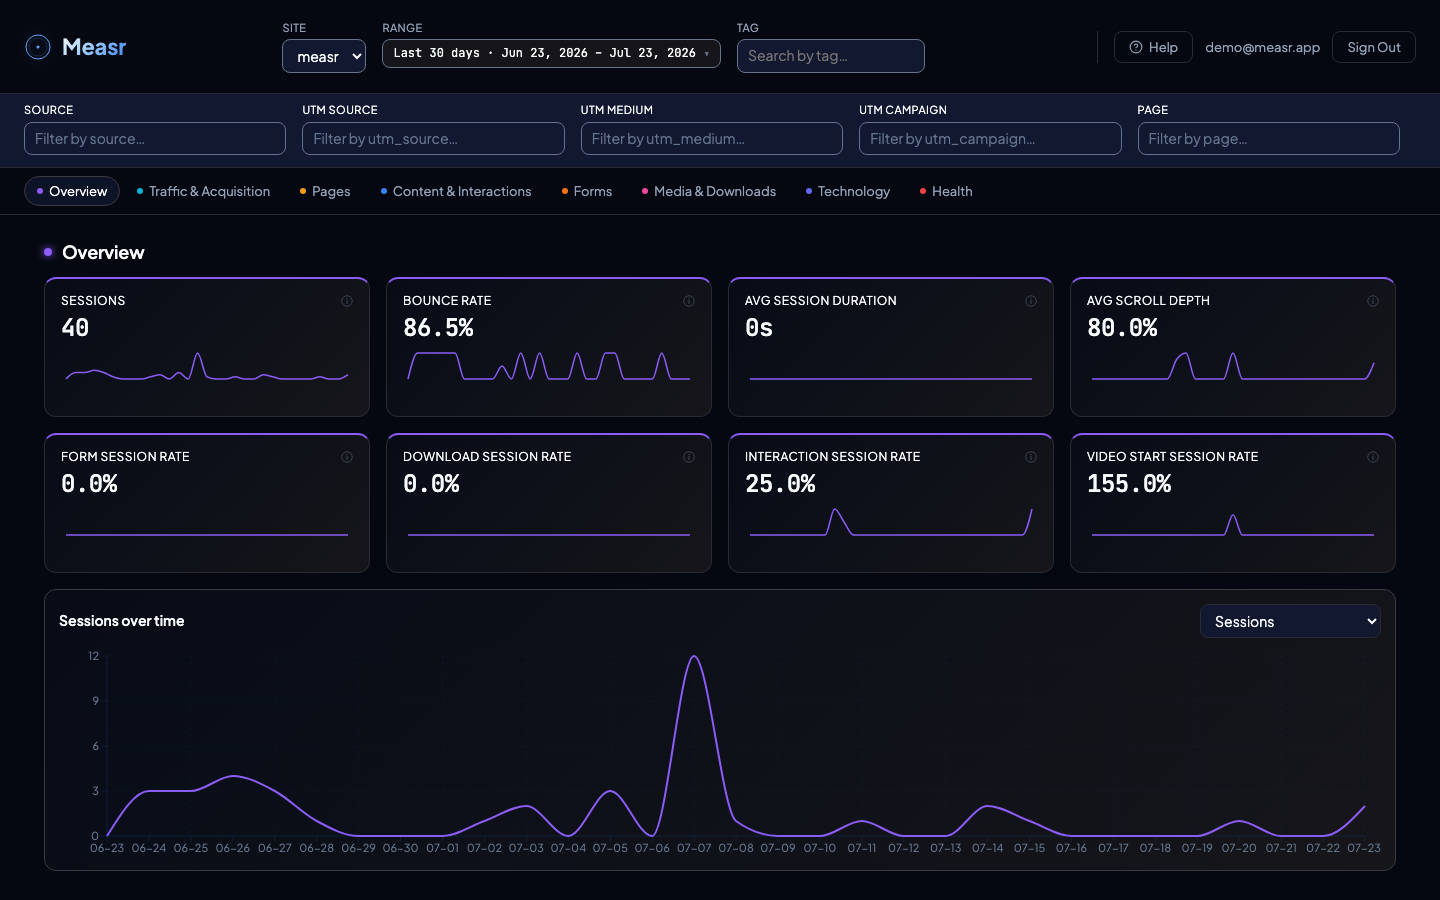
- Site switches between the sites tracked in this Supabase project (each
siteIdis one entry). - Range sets the reporting window; all KPIs, charts, and tables re-query.
- Tag narrows to sessions labeled with a tag, if your install uses session tagging.
- Refresh refetches the latest data for the current view (v1.4.1). The selected site, date range, and every active filter stay as they are — no browser reload needed.
On a phone
Since v1.6.2 the dashboard fits a phone screen. The pinned header keeps the site picker and the date range; the six dimension filters move into a Filters sheet that slides in from the right, with a badge showing how many are active. Each filter still applies the moment you change it. Done only closes the sheet, and Reset sits in its footer. Menu holds the help link, your email, and Sign Out. The section pills scroll sideways under the header, and tapping one lands the section title directly below the pinned area. KPI cards sit two per row; charts and tables take the full width. Nothing changes on screens wider than 768px.
The six dimension filters
Source, UTM Source, UTM Medium, UTM Campaign, UTM Content, Page are global dimension filters (UTM Content joined in v1.4.0). Combine them to answer questions like "how did LinkedIn visitors behave on the pricing page". The dropdown suggestions facet each other (v1.4.2): once a filter is active, the other dropdowns only offer values that co-occur with it in the current window — a dropdown is never narrowed by its own selection, so you can switch its value without clearing first. The UTM filters read the same values as the UTM tables in Traffic & Acquisition; how those values get onto your URLs is covered in campaign tagging.
Every table filters (v1.4.3): the Video performance and Previous page tables — formerly documented full-window exceptions — are now filtered server-side (migration 057), so every KPI, chart, and table on the page reflects the active filter set.
Row-click section filters
Many tables also work as filters for their own section: click a row (a page, a traffic source, an interaction element) and the section's charts and tables narrow to that value. Click the row again to clear it. Switching site or date range clears section filters automatically, and the Reset button next to the dimension filters clears everything at once.
Frequently asked
Can one dashboard show several websites?
siteId into the same Supabase project, and the site picker switches between them. Per-user access can be limited with the allowed_sites claim.