What it shows
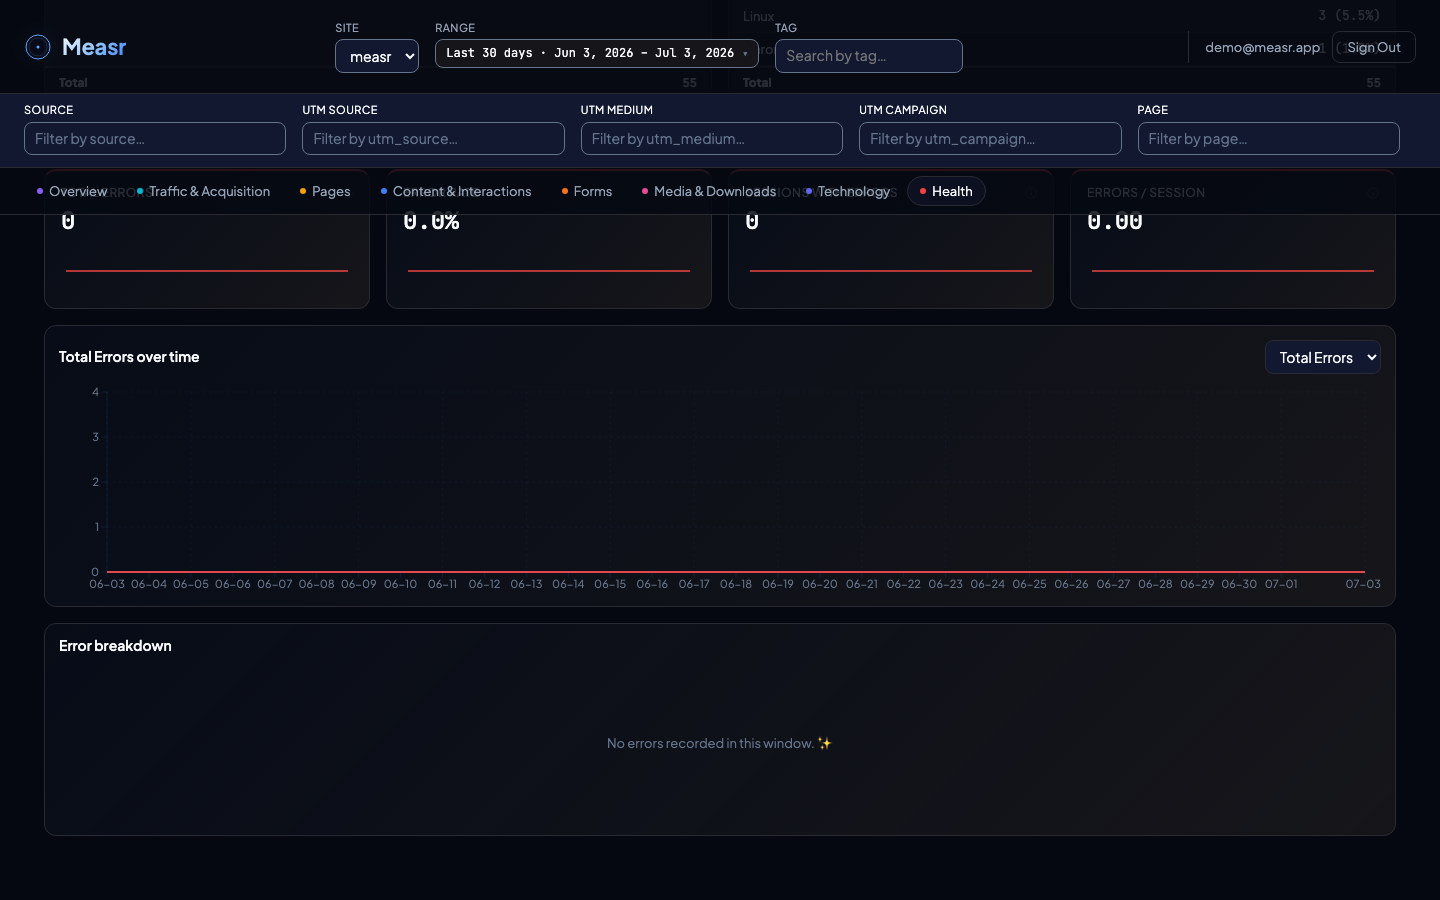
Four KPIs (Total Errors, Error Rate, Sessions with Errors, Errors per Session), an Errors over time trend, and the Error breakdown table grouped by message.
What the numbers mean
| Metric | Definition |
|---|---|
| Total Errors | User-facing errors: failed form submissions, download issues, and other actions that didn't complete as expected. |
| Error Rate | Total errors divided by total sessions (can exceed 100%). |
| Sessions with Errors | Sessions with at least one error. |
| Errors per Session | Average errors per session. |
| Session Rate (table) | % of all sessions in the window that hit this specific error. |
Sanitized before insert: error messages are cleaned before they reach the database. Emails, tokens, and long digit runs become [REDACTED].
How the filters apply
The section respects the global filters, and error rows are clickable as a drill-down: select a message and the four KPIs and the trend re-scope to that error's events, while the rate denominators stay at all sessions in the window. Click again to clear.
How to implement it
Automatic: errors are caught via window.onerror and unhandled promise rejections, sanitized, and deduplicated (identical messages within one second count once). Nothing to configure. See tracking modules for the module details and troubleshooting for what to do when this section itself surprises you.