What it shows
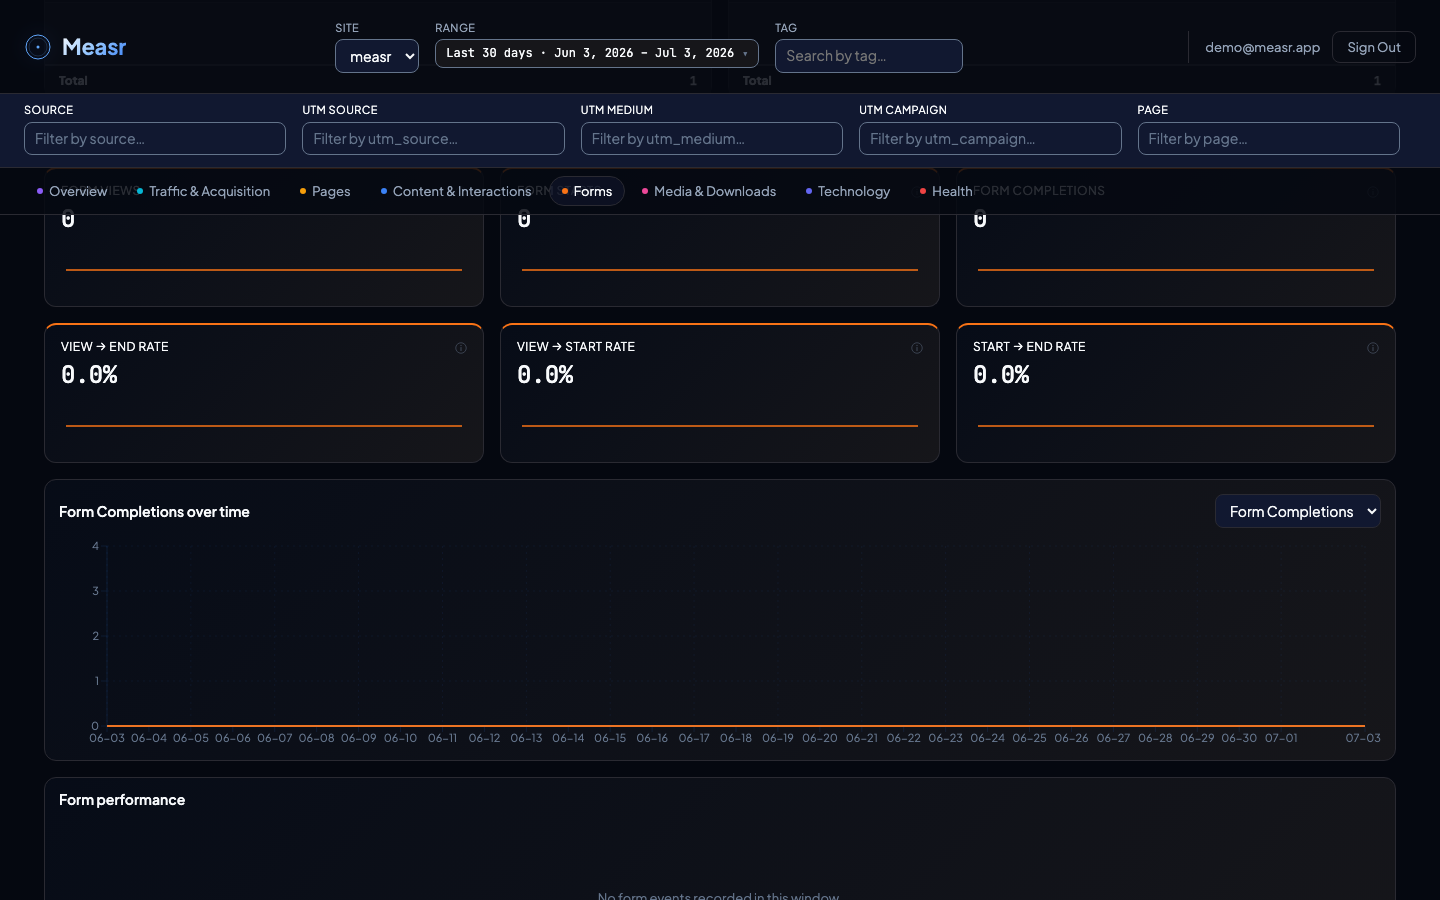
Six KPIs in two rows (volumes: Form Views, Form Starts, Form Ends; rates: View→End, View→Start, Start→End), a Form funnel over time trend, and the Form performance table with one row per registered form.
What the numbers mean
| Metric | Definition |
|---|---|
| Form Views | Times a form became visible in the viewport (fires once per pageview when 50%+ of the form is visible). |
| Form Starts | Times a visitor began filling in a form (once per form per pageview). |
| Form Ends | Times a form was submitted (once per submission). |
| View → Start Rate | % of form views where the visitor started filling in. |
| Start → End Rate | % of started forms that were submitted. |
| View → End Rate | % of form views that resulted in a submission. |
| Session Rate (table) | % of all sessions in the window that completed this form. |
Reading the funnel: a high view-to-start drop means the form looks like too much work; a high start-to-submit drop means something inside it fails or asks too much.
How the filters apply
The section respects the global filters, and form rows are clickable: select a form to narrow the section's trend to that form; click again to clear.
How to implement it
Form tracking is opt-in per form. Register each form you care about and the SDK watches its full lifecycle:
Measr.trackForm('#waitlist-form', { name: 'Waitlist' });For multi-step wizards and AJAX-only flows, call the three manual variants yourself: trackFormView(name), trackFormStart(name), trackFormEnd(name). The dashboard turns the three events into the view → start → submit funnel. Full signatures in tracking modules.