What it shows
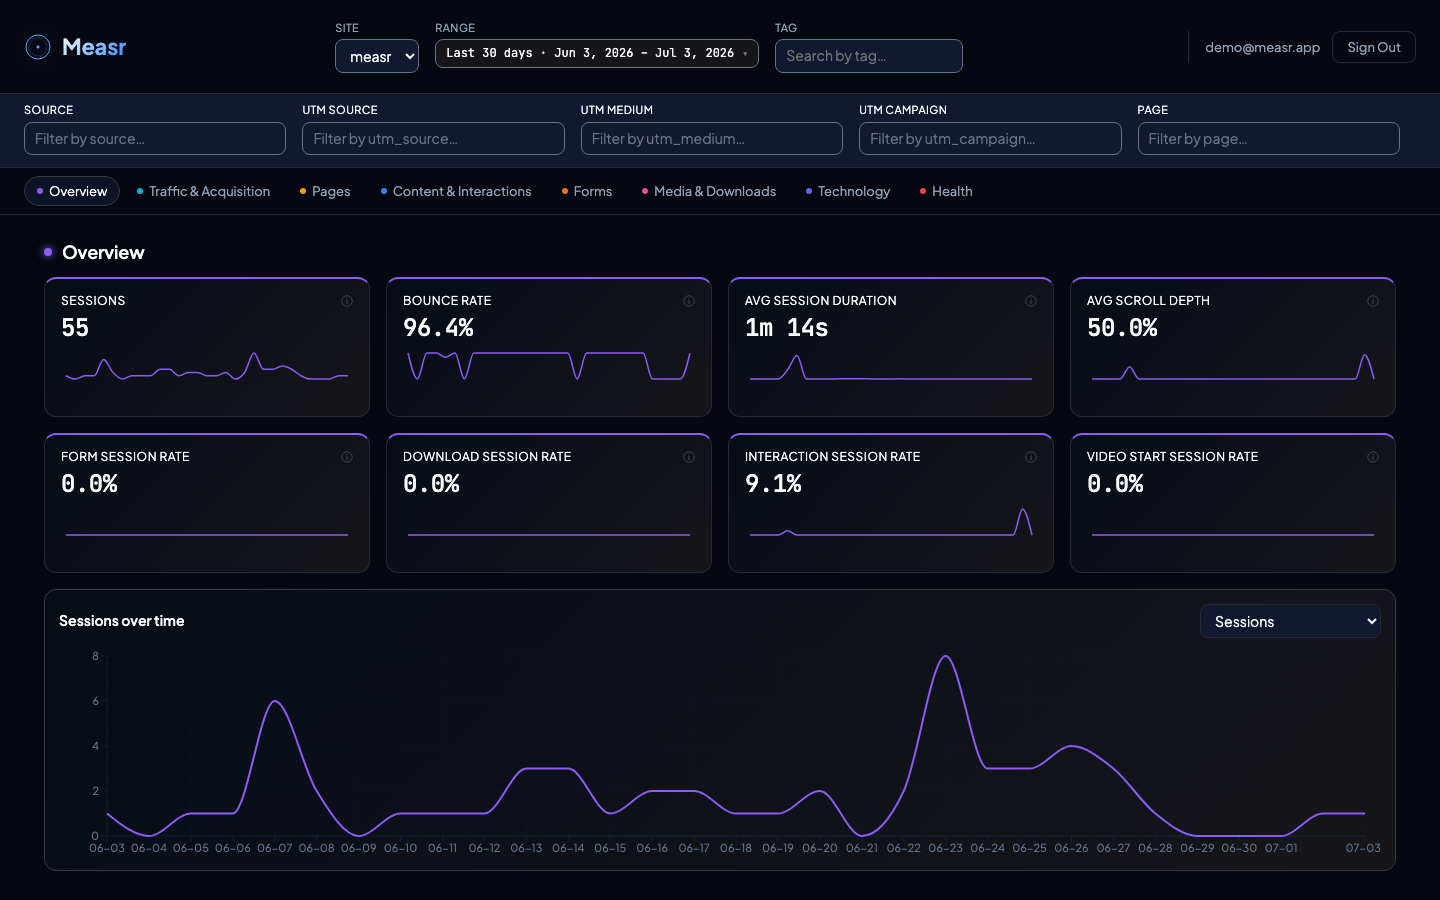
Row one is audience: Sessions, Bounce Rate, Avg Session Duration, Avg Scroll Depth. Row two is engagement, expressed as session rates: the share of sessions with a form submit, a download, an interaction, or a video start. Every card carries a sparkline of its daily values.
What the numbers mean
| Card | Definition |
|---|---|
| Sessions | Total unique sessions on your site. |
| Bounce Rate | % of single-pageview sessions with no engagement event (interaction, video, form start). |
| Avg Session Duration | Average time spent per session, capped at 30 minutes. |
| Avg Scroll Depth | How far down the page visitors scroll on average (tracked once per pageview). |
| Form Session Rate | % of sessions where a form was submitted. |
| Download Session Rate | % of sessions where a file was downloaded. |
| Interaction Session Rate | % of sessions with at least one interaction (CTA clicks, accordion opens, and other clicks with visible results). |
| Video Start Session Rate | % of sessions where a video was played. |
Two definitions worth knowing: a session bounces only if it has a single page view AND no engagement event (an interaction, video start, or form start marks it engaged). And session duration is capped at 30 minutes per session before averaging, so a tab left open overnight cannot distort the number.
The trend chart
The Metrics over time chart plots daily values for any of twelve metrics: the eight cards above plus the raw counts behind them (form submits, downloads, interactions, video starts). Pick the metric in the chart's dropdown; the comparison line appears when the date range has a comparison window set.
How the filters apply
All eight cards and the trend chart respect the global filters: site, date range, tag, and the six dimension filters. Set UTM Campaign to one campaign and the Overview becomes that campaign's overview.
How to implement it
The Overview needs no configuration of its own. Sessions, bounce, duration, and scroll depth come from the automatic page-view and scroll modules; the engagement rates come from the interaction, download, video, and form modules. See tracking modules for what fires automatically and which modules need wiring.